
https://www.tumblr.com/search/small+multiples
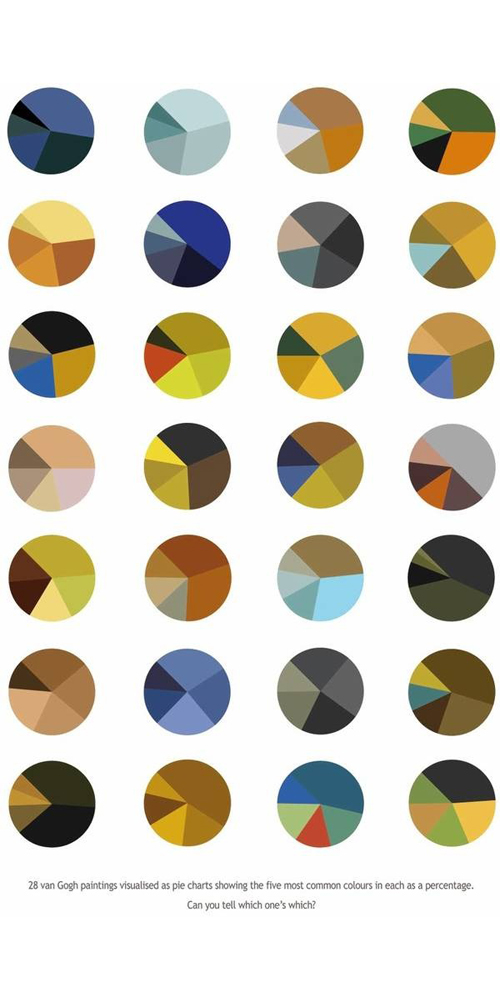
28 Pie Charts Showing the 5 Most Common Colors in Van Gogh’s Paintings
The caption of this image says “28 Van Gogh paintings visualized as pie charts showing the five most common colors in each as in percentage.” I chose this image because I believe it 100% relates to data bountiful. This image compares 28 Van Gogh paintings by the color used in each of them. By placing these small multiples in this arrangement it really allows the viewer to compare the colors that were used in each of the paintings. It also shows the changes he made in color from painting to painting. Maybe the two blue ones at the top left were painted one after the other. This happens to also show the scope in time each painting was made. Having the paintings laid out in this format gives the viewers a different perspective. The image is also visually stimulating, I didn’t see it as a bunch of small pie charts, I saw circles of color with some sort of 3D element added to them. That’s what made me more drawn to it once I read the caption. This would be really boring data to look at if it were written down, but adding this creative spin to it makes it a real success.
According to Tufte, small multiples will do a few things, on being “change of data, not changes in data frames”. The circles stay in the same shape and order creating implied columns and rows which means it is really only using one mode to portray the information. Besides the small caption on the bottom, this image lacks words and numbers which almost make it more interesting. The simple look then has the viewer appreciate the story behind the colorful circles and lets their imagination wonder about which painting is which just by identifying them by their top five most used colors.
